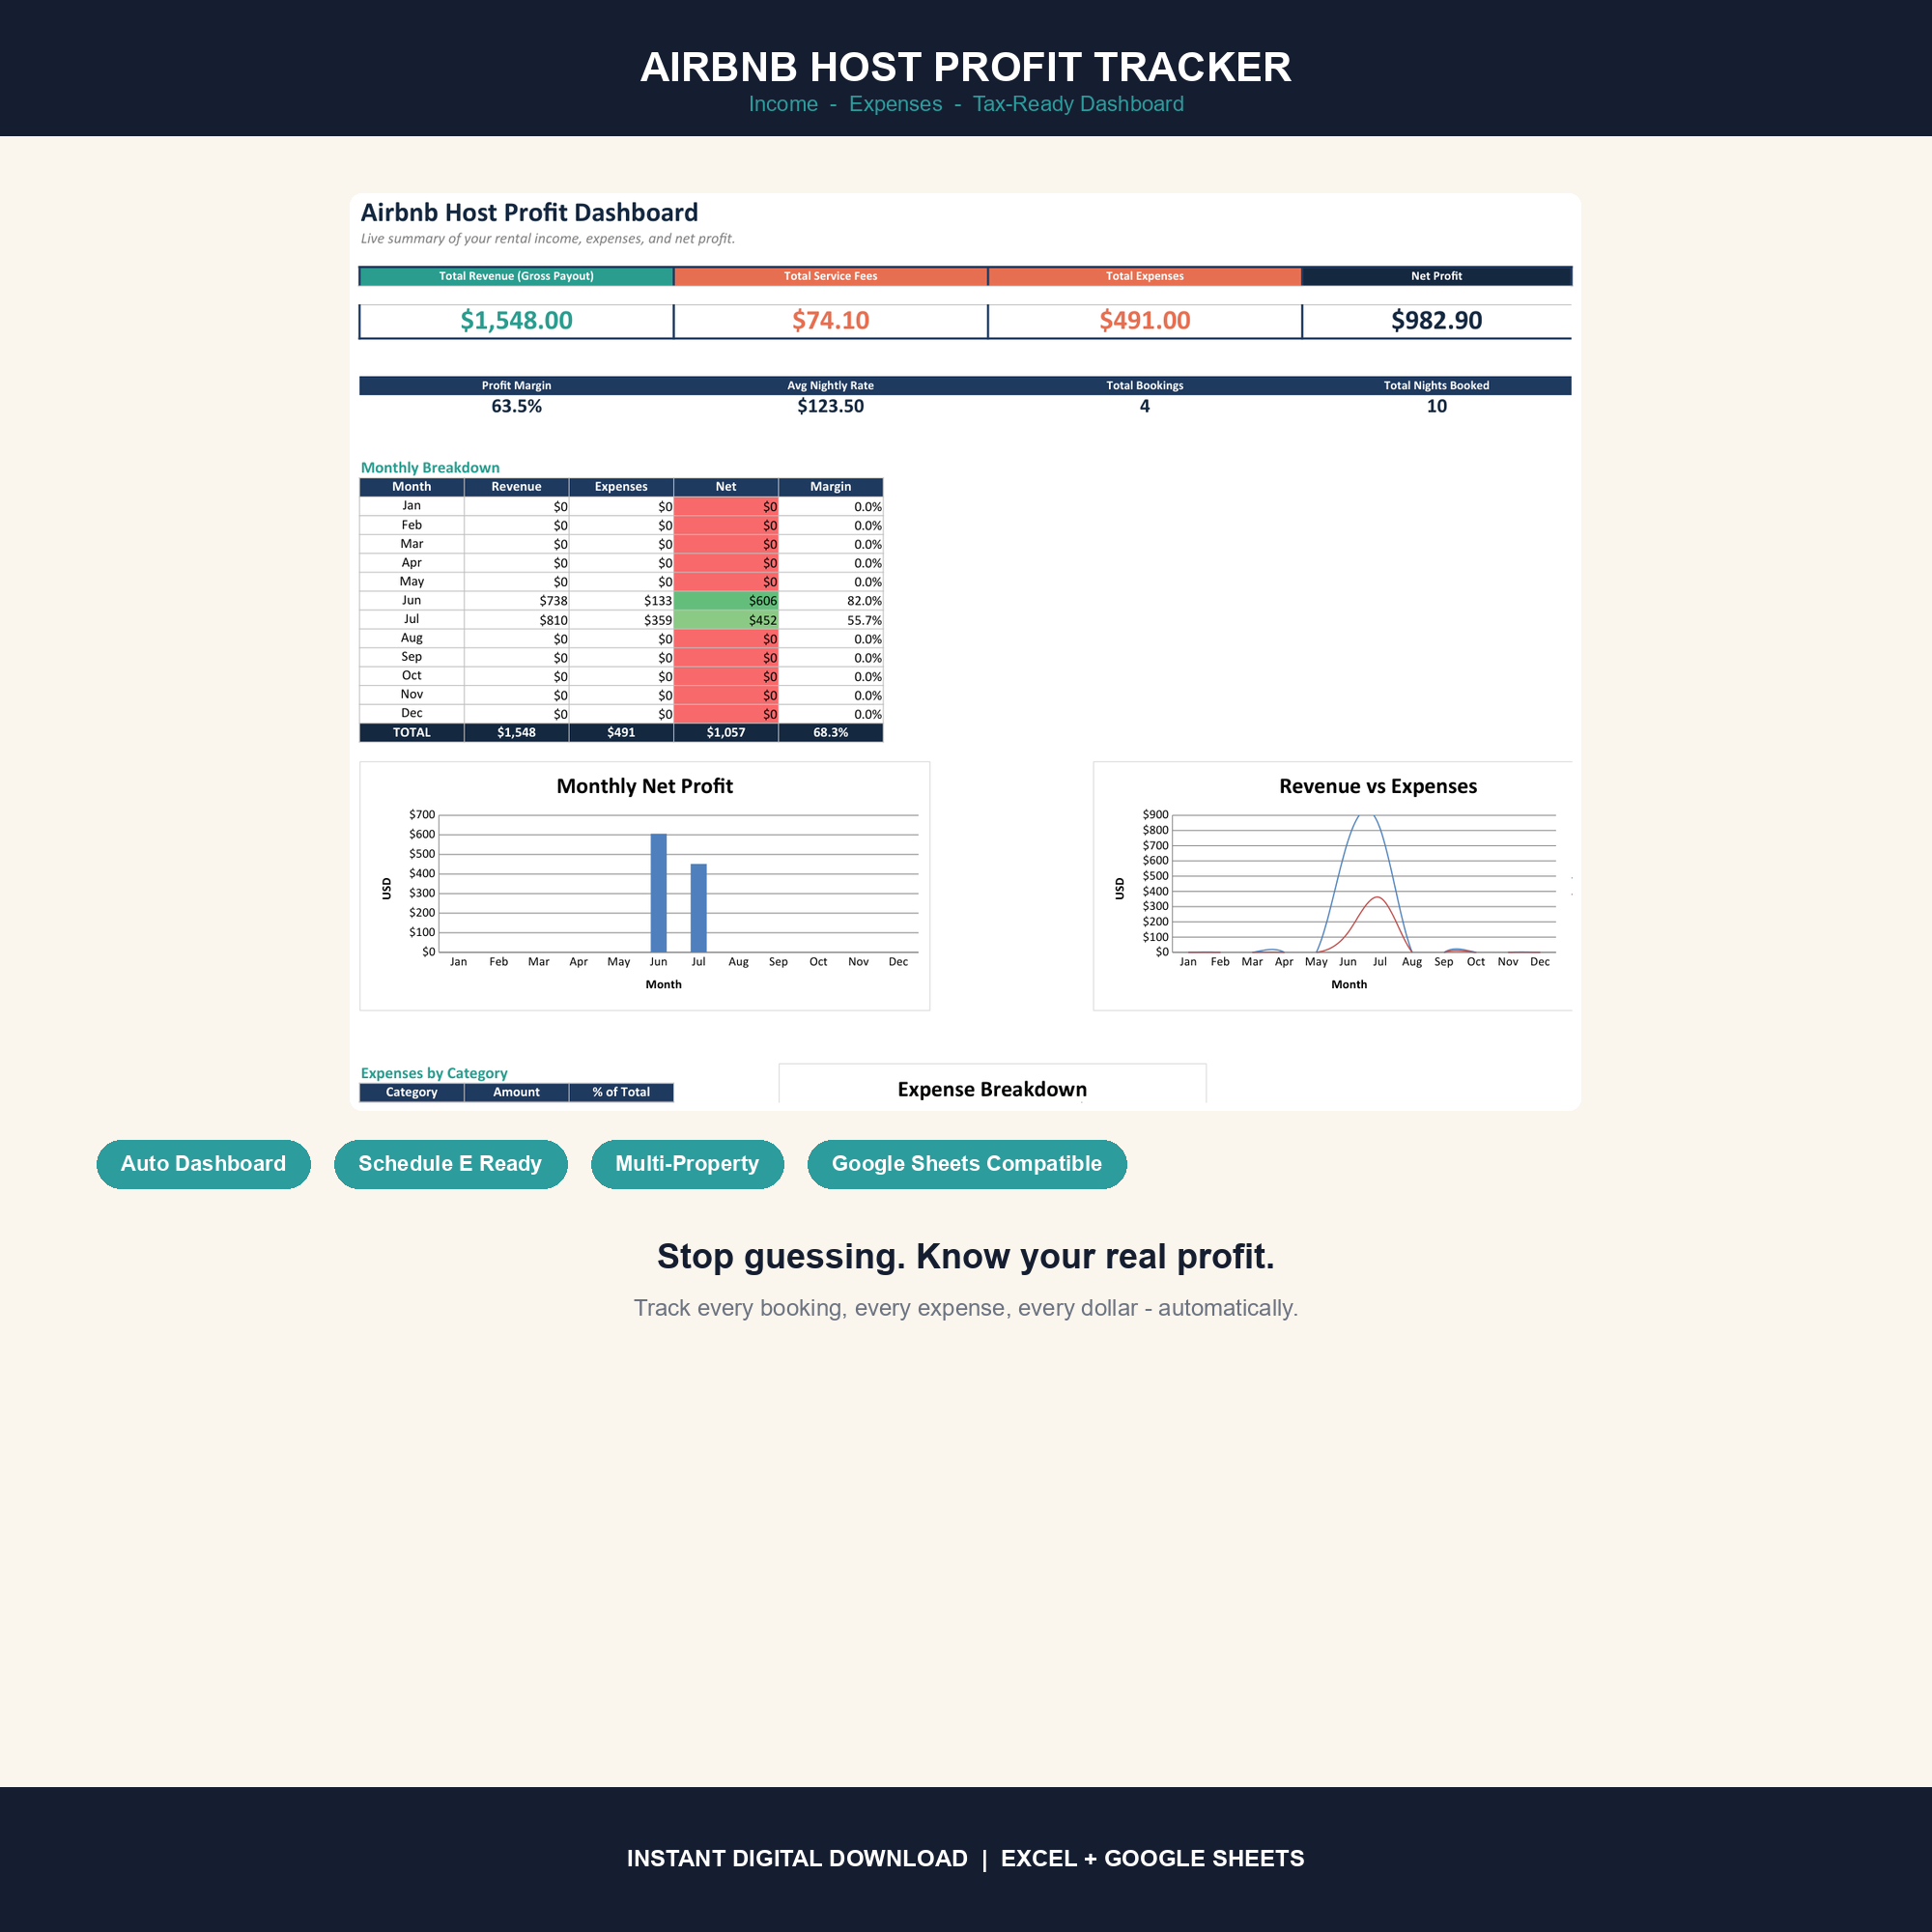
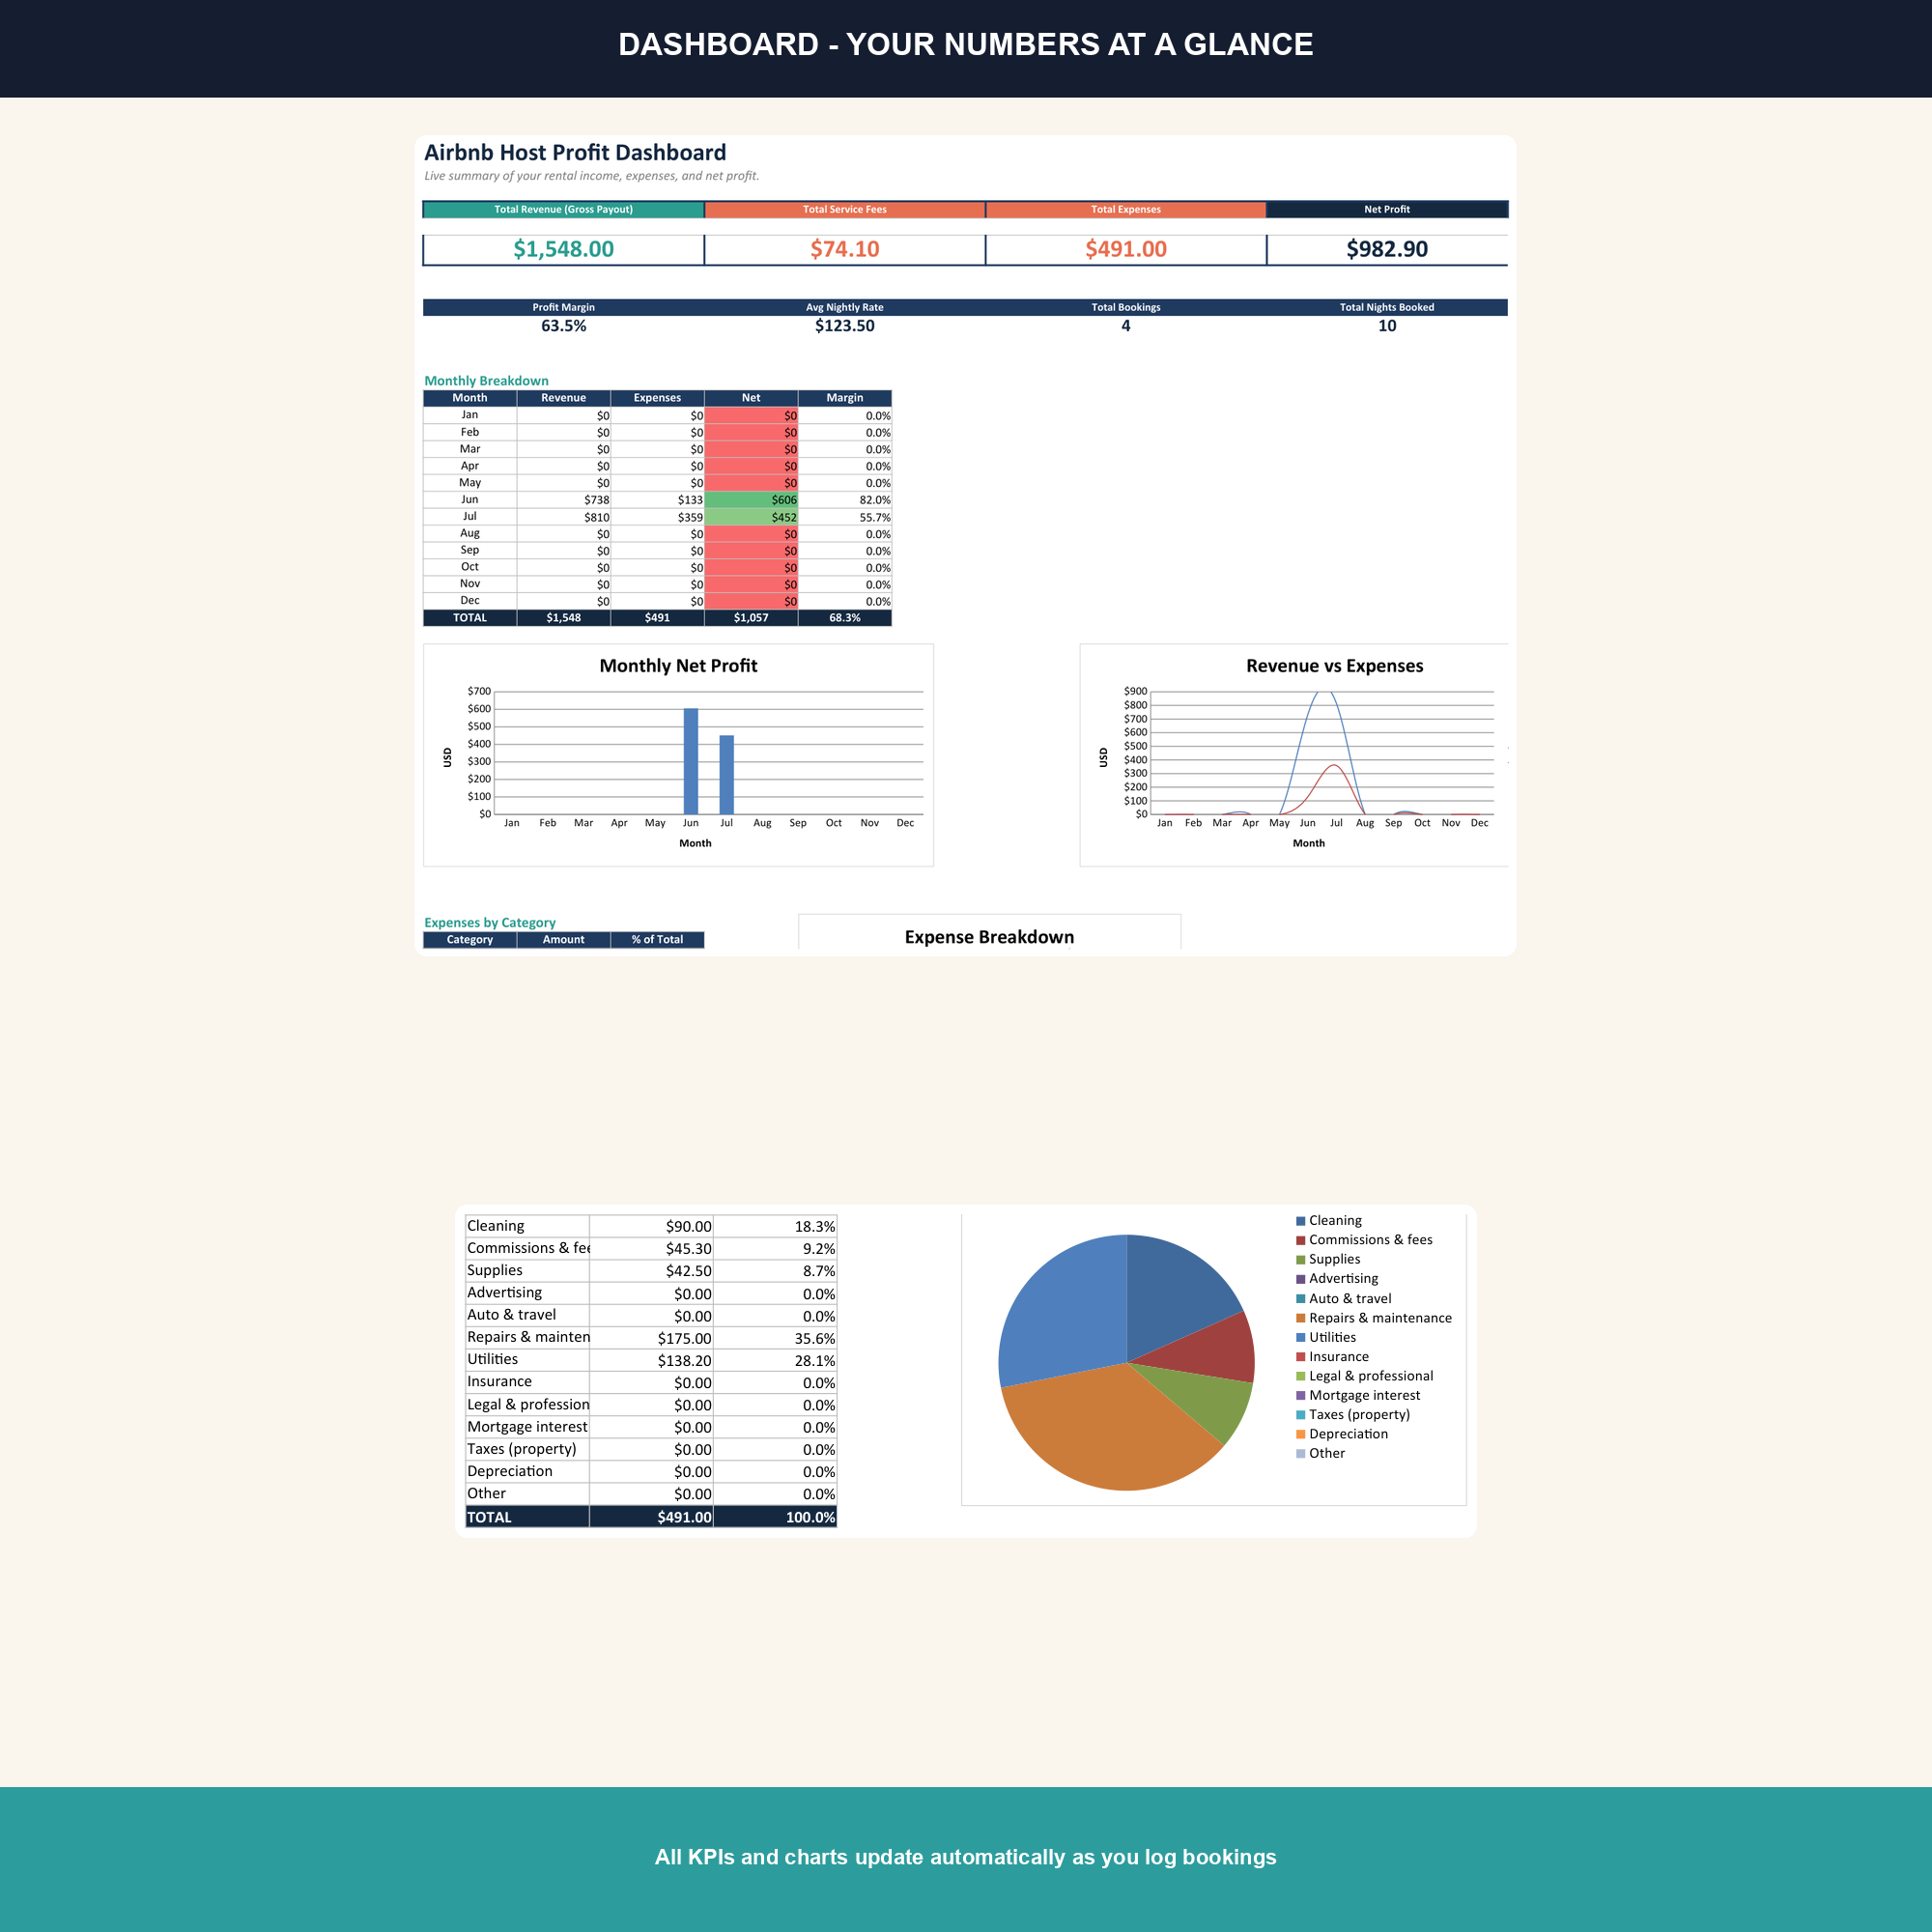
Running an Airbnb is supposed to be passive income. In practice it is spreadsheets, platforms, fees, cleanings, utilities, mortgages, and the sinking feeling at tax time that you cannot prove which property actually made money. The Airbnb Host Profit Tracker Spreadsheet replaces that fog with five linked sheets and 417 formulas that turn raw bookings into per-property profit you can defend in front of a CPA.
What this template tracks
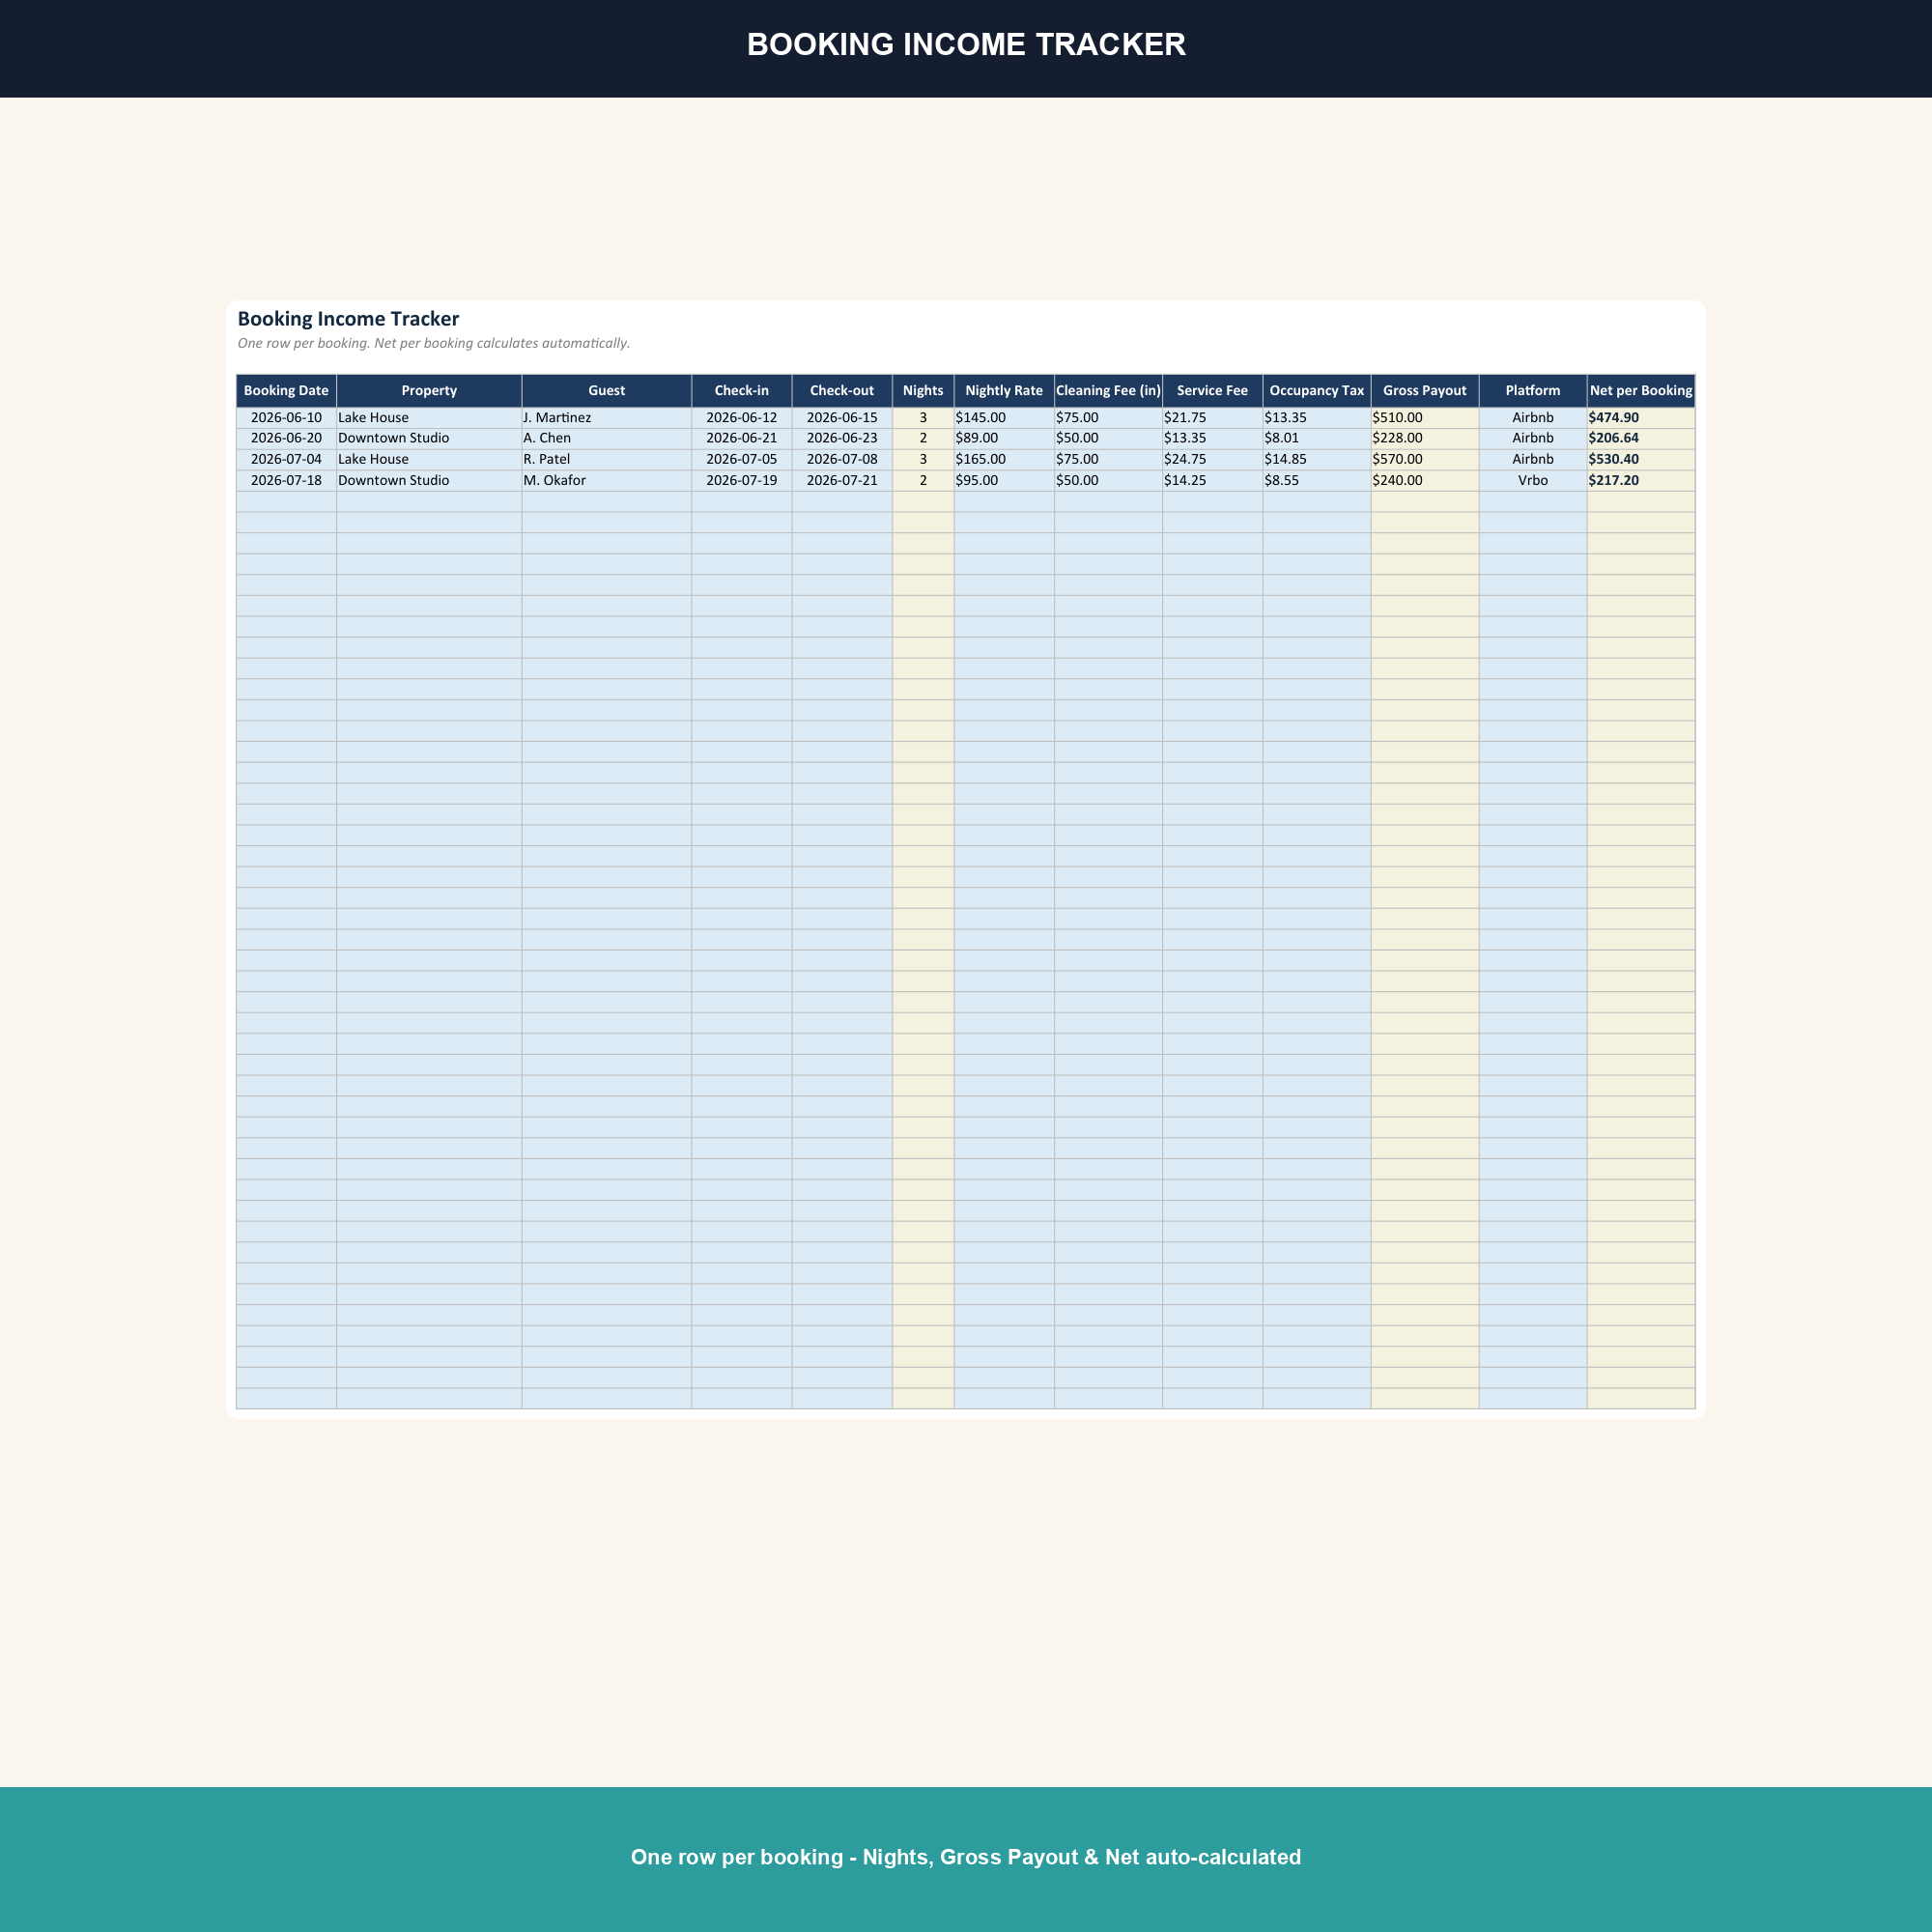
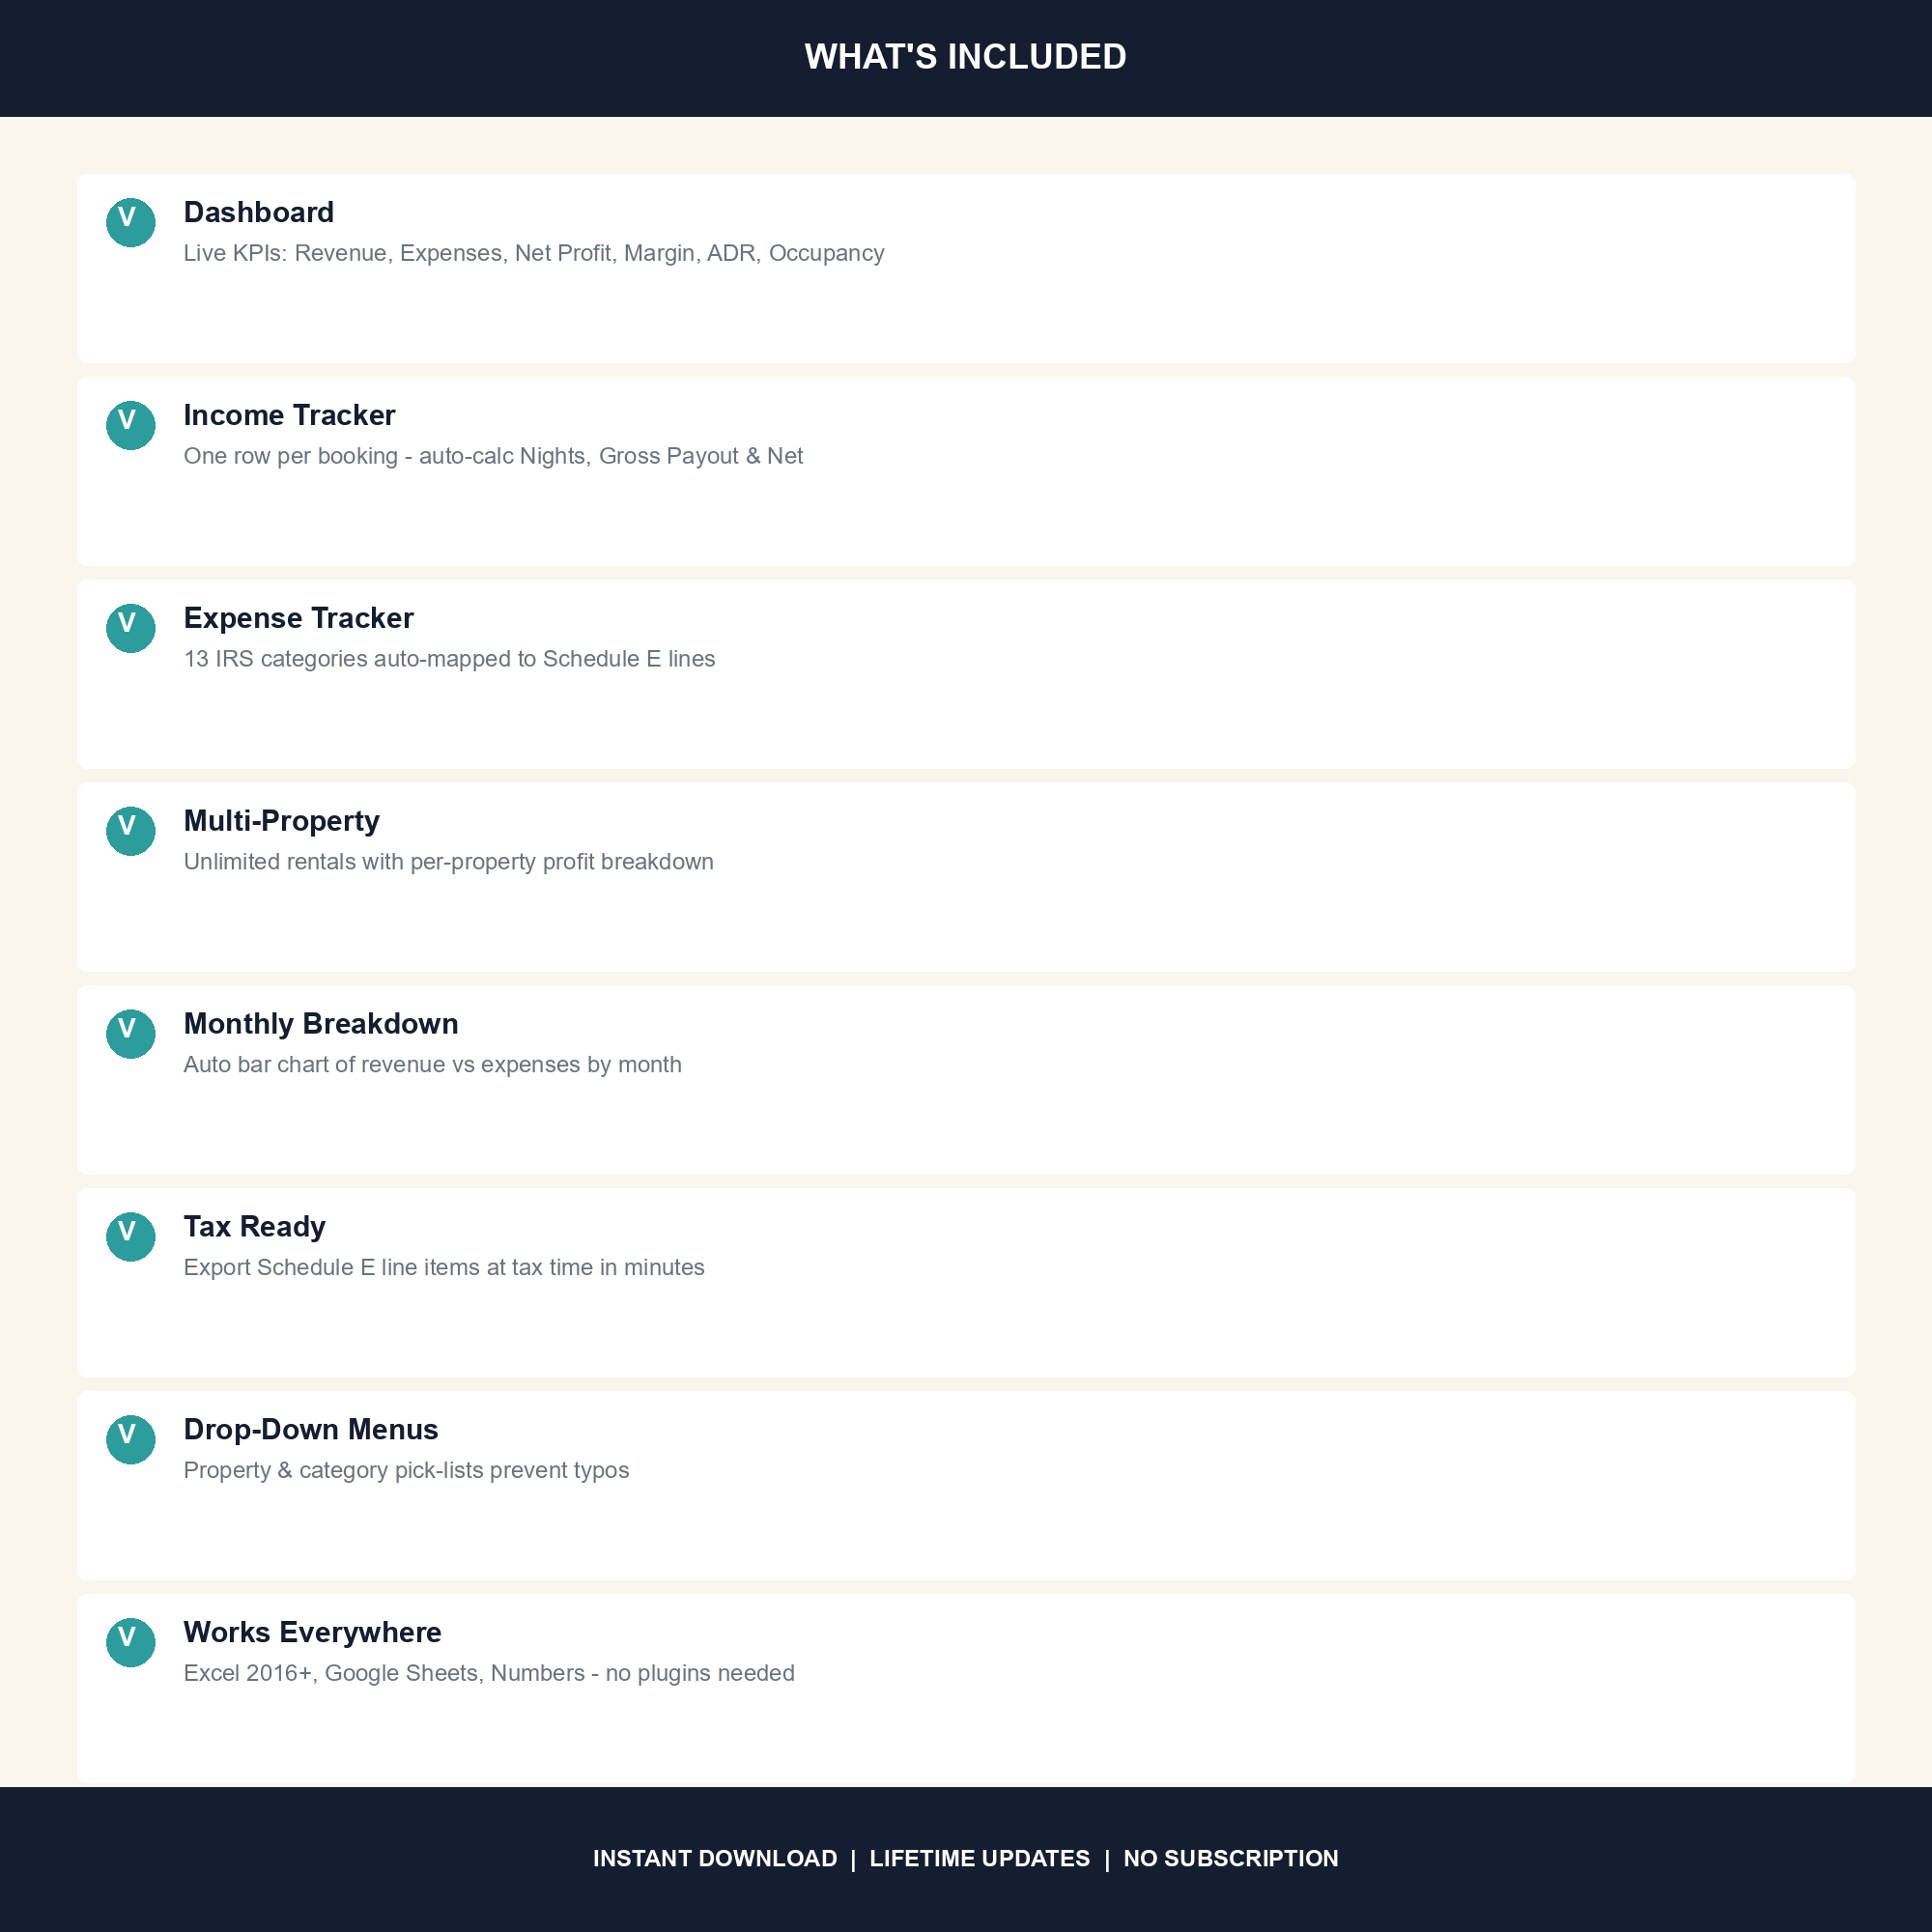
- Per-property income. Log nightly rates, cleaning fees, and guest counts for every booking across every property you own or co-host. The tracker rolls them up month-by-month and year-by-year so you can see seasonality at a glance.
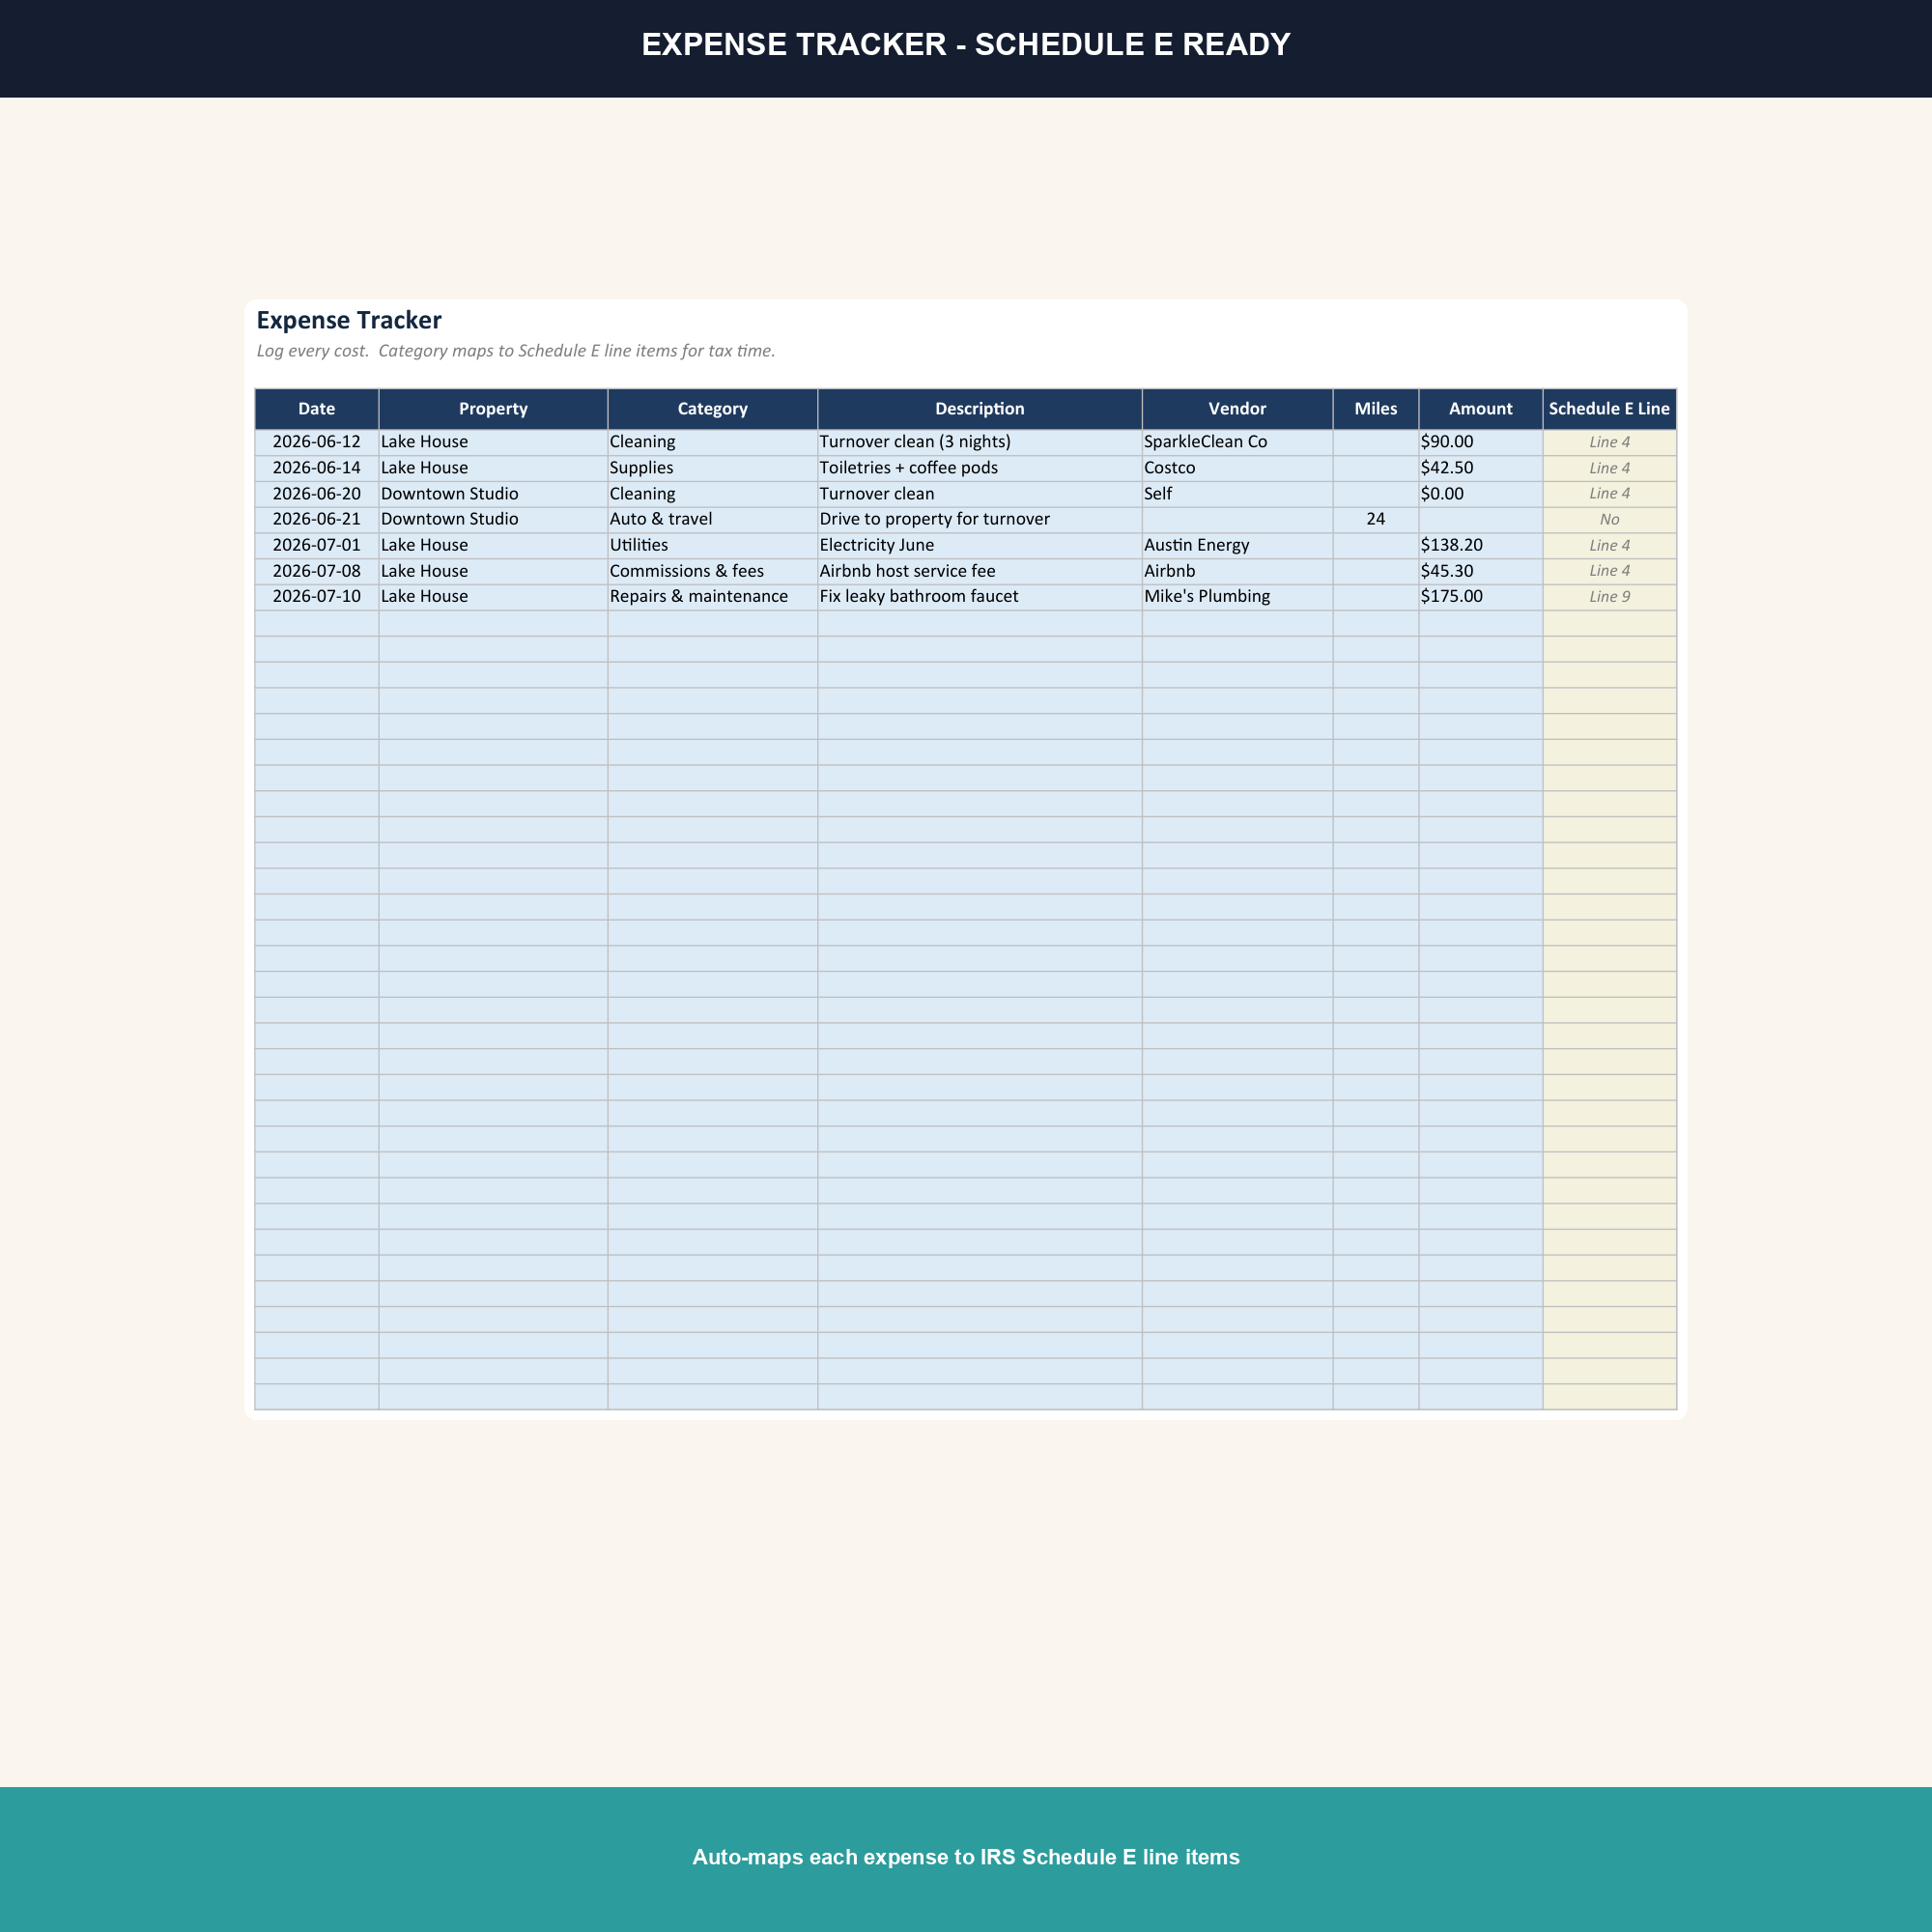
- Every fee, every month. Airbnb host fee (usually 3% of the booking), cleaning payroll, supplies, utilities, internet, mortgage interest, property tax, insurance, HOA, repairs, and capex. Categorise once; the dashboard does the rest.
- Occupancy and ADR. Track occupancy rate, average daily rate, and RevPAR per property per month. Spot a property whose ADR is slipping before it costs you a season.
- Tax-ready totals. Annual summary rolls deductions and net income into the line items you need for Schedule E. Hand the printed summary to your CPA and you are done.
How to use it
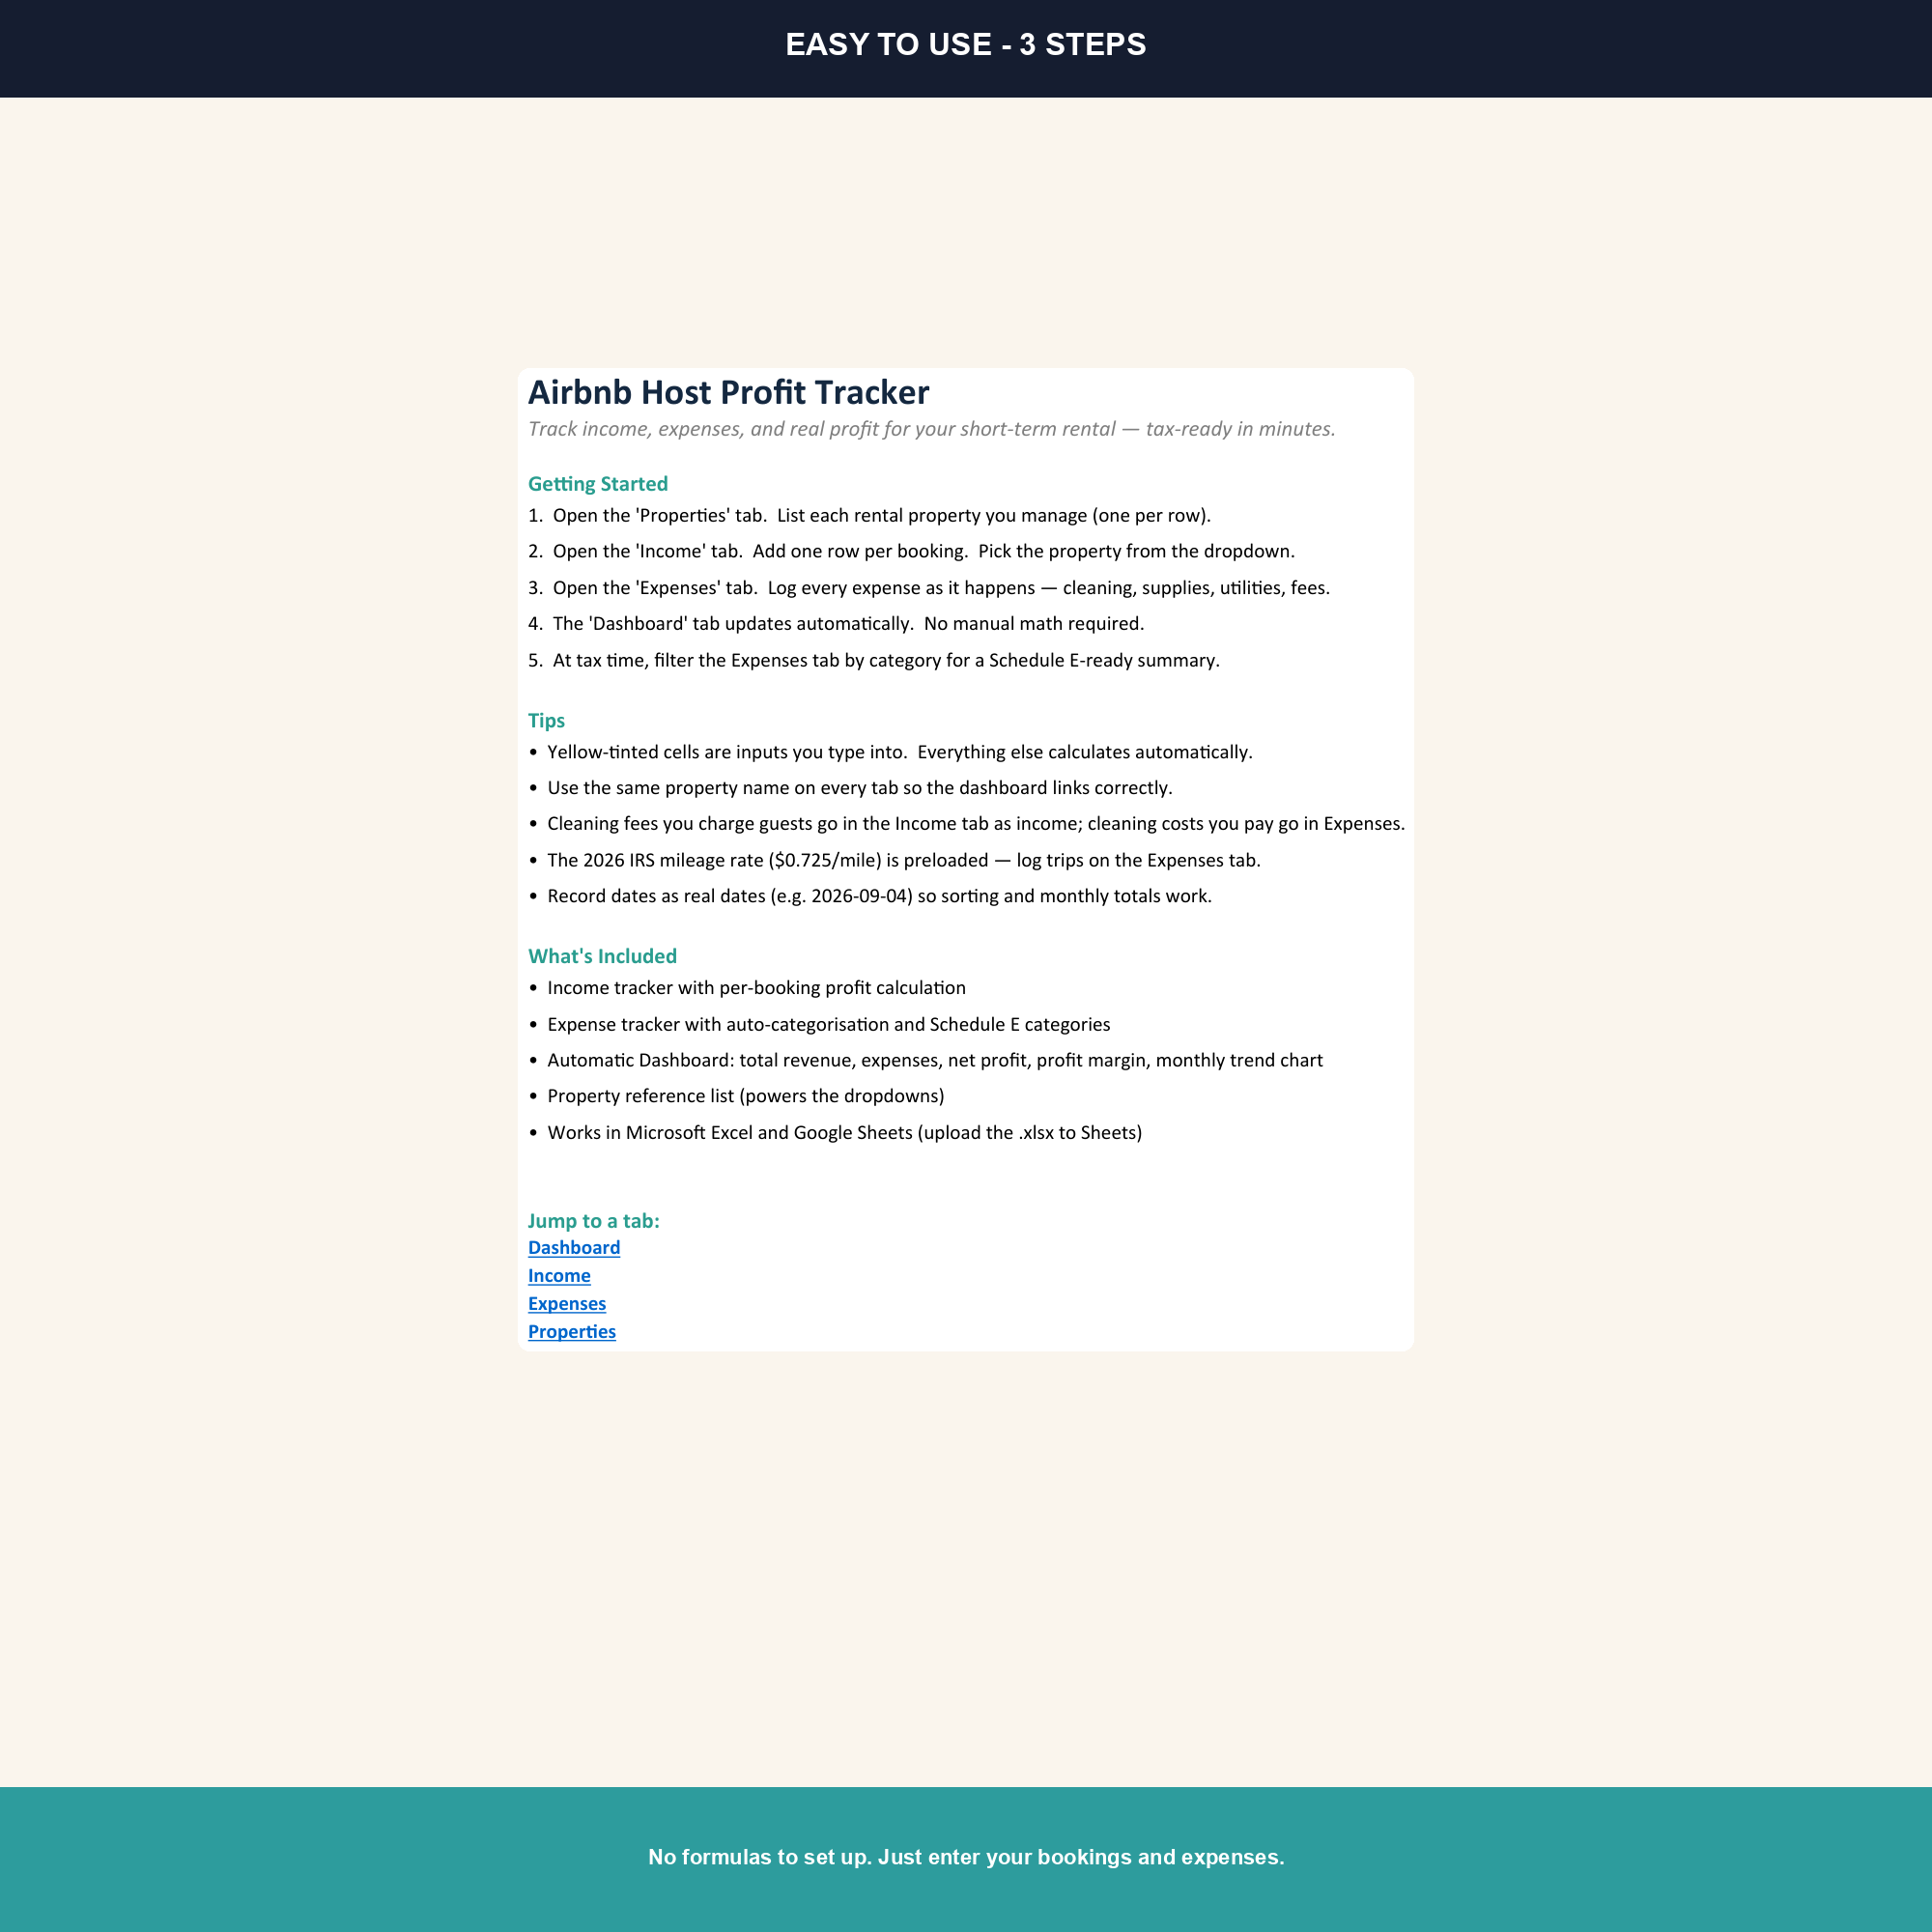
Open the file in Excel 2016+ or upload it to Google Sheets (the templates are fully compatible with both — every formula is portable). Start in the Properties tab and add each property you operate. Then log every booking as it happens in the Income tab and every bill in the Expenses tab. The Dashboard and Annual Summary update themselves. Most hosts spend about 10 minutes a week keeping it current.
Why this matters
Most Airbnb hosts undercount their real costs because the platform hides the host fee inside the payout and cleaning costs happen between guests. A property that looks like it grosses $3,000 a month can net $800 after fees, cleaning, utilities, and supplies — and you do not find that out until you do the math. This template does the math. It surfaces the per-property net monthly profit so you can decide whether to raise rates, switch minimum-stay rules, or sunset a listing that is quietly losing money. At tax time the Annual Summary tab hands your accountant a single page instead of twelve months of scattered receipts.
What is in the workbook
Five linked sheets — Properties, Income, Expenses, Dashboard, Annual Summary — plus 417 formulas, three charts on the dashboard, and pre-built categories covering the expenses the IRS actually allows for short-term rentals. No macros, no VBA, nothing that breaks when you switch machines.
Who this template is for
Hosts with one to ten properties who want a single source of truth they control — not a third-party dashboard that disappears when the subscription lapses. If you co-host, run multiple listings on different platforms, or simply want a clean year-end handoff to your accountant, this is built for you.
Frequently asked questions
Does it work in Google Sheets?
Yes. Upload the .xlsx to Google Drive and open with Sheets. All 417 formulas convert cleanly. You can keep editing it in either app.
Do I need Excel?
No. Google Sheets is enough. The file uses no macros, no VBA, and no features exclusive to Microsoft Excel.
How many properties can I track?
The template ships with 10 pre-built property rows and 200+ booking rows. Adding more is a copy-and-paste.
Does it calculate Schedule E figures?
The Annual Summary tab totals income and deductions by IRS category. Your CPA uses those totals to populate Schedule E.